
植物生态学报 ›› 2006, Vol. 30 ›› Issue (3): 404-413.DOI: 10.17521/cjpe.2006.0054
于德永, 潘耀忠*( ), 刘鑫, 王艳艳, 朱文泉
接受日期:2006-01-22
发布日期:2006-05-30
通讯作者:
潘耀忠
作者简介:*E-mail: pyz@ires.cn基金资助:
YU De-Yong, PAN Yan-Yan*(), LIU Xin, WANG Yan-Yan, ZHU Wen-Quan
Accepted:2006-01-22
Published:2006-05-30
Contact:
PAN Yan-Yan
摘要:
该文利用高空间分辨率Landsat 7 TM卫星影像及中空间分辨率MODIS卫星影像获取生态系统类型、质量状况等参数,计算湖州市各类生态系统的净第一性生产力(Net primary productivity, NPP),结合地理属性数据及统计数据计算出各类生态系统的生态资产,并应用于当地社会、经济活动分析。结果表明:1) 4年间湖州市林地、水田、灌丛、裸地4类占有明显优势,占全市的面积比例平均达87%以上,草地、水域/湿地、旱地3类占全市面积的13%左右;2) 湖州市生态资产平均为203.33亿元·a-1,森林对生态资产的平均贡献率为73.22%,森林及耕地在全市的生态资产构成中占主要地位,各县(区)的生态资产呈波动递减,平均生态资产依次排列为:安吉县(91.76亿元·a-1)>长兴县(41.33亿元·a-1)>吴兴区(29.31亿元·a-1)>德清县(28.27亿元·a-1)>南浔区(12.66亿元·a-1); 3) 4年中生态资产在国民经济中的比重由大到小排列均为:安吉县>长兴县>德清县>市辖区,但各县(区)生态资产占GDP的比重均逐年下降(市辖区仅在2002年略高于2001年,但4年中总体趋势也在下降);4年中人均及地均生态资产均按安吉县>德清县>长兴县>市辖区的顺序排列。各县(区)人均及地均生态资产与国民生产总值的变化均呈相反趋势,即经济发展相对较快的地方,其人均及地均占有的生态资产相对低,同时其人均及地均污染水平高,这些都反映出目前当地经济增长特点,即经济高速发展的同时也带来了较为严重的环境问题。
于德永, 潘耀忠, 刘鑫, 王艳艳, 朱文泉. 湖州市生态资产遥感测量及其在社会经济中的应用. 植物生态学报, 2006, 30(3): 404-413. DOI: 10.17521/cjpe.2006.0054
YU De-Yong, PAN Yan-Yan, LIU Xin, WANG Yan-Yan, ZHU Wen-Quan. ECOLOGICAL CAPITAL MEASUREMENT BY REMOTELY SENSED DATA FOR HUZHOU AND ITS SOCIO-ECONOMIC APPLICATION. Chinese Journal of Plant Ecology, 2006, 30(3): 404-413. DOI: 10.17521/cjpe.2006.0054
| 时间序列 Time serials | 日序数 Calendar serials | 日历 Calendar days (Month.day) | |||||||||||
|---|---|---|---|---|---|---|---|---|---|---|---|---|---|
| 1 | 001~032 | 12.27~02.01 | |||||||||||
| 2 | 033~064 | 02.02~03.05 | |||||||||||
| 3 | 065~096 | 03.06~04.06 | |||||||||||
| 4 | 097~128 | 04.07~05.08 | |||||||||||
| 5 | 129~160 | 05.09~06.09 | |||||||||||
| 6 | 161~192 | 06.10~07.11 | |||||||||||
| 7 | 193~224 | 07.12~08.12 | |||||||||||
| 8 | 225~256 | 08.13~09.13 | |||||||||||
| 9 | 257~288 | 09.14~10.15 | |||||||||||
| 10 | 289~320 | 10.16~11.16 | |||||||||||
| 11 | 321~360 | 11.17~12.26 | |||||||||||
表1 MODIS NDVI数据时间序列与日历对照表
Table 1 The calendar days and corresponding time serials of each period of MODIS NDVI data
| 时间序列 Time serials | 日序数 Calendar serials | 日历 Calendar days (Month.day) | |||||||||||
|---|---|---|---|---|---|---|---|---|---|---|---|---|---|
| 1 | 001~032 | 12.27~02.01 | |||||||||||
| 2 | 033~064 | 02.02~03.05 | |||||||||||
| 3 | 065~096 | 03.06~04.06 | |||||||||||
| 4 | 097~128 | 04.07~05.08 | |||||||||||
| 5 | 129~160 | 05.09~06.09 | |||||||||||
| 6 | 161~192 | 06.10~07.11 | |||||||||||
| 7 | 193~224 | 07.12~08.12 | |||||||||||
| 8 | 225~256 | 08.13~09.13 | |||||||||||
| 9 | 257~288 | 09.14~10.15 | |||||||||||
| 10 | 289~320 | 10.16~11.16 | |||||||||||
| 11 | 321~360 | 11.17~12.26 | |||||||||||
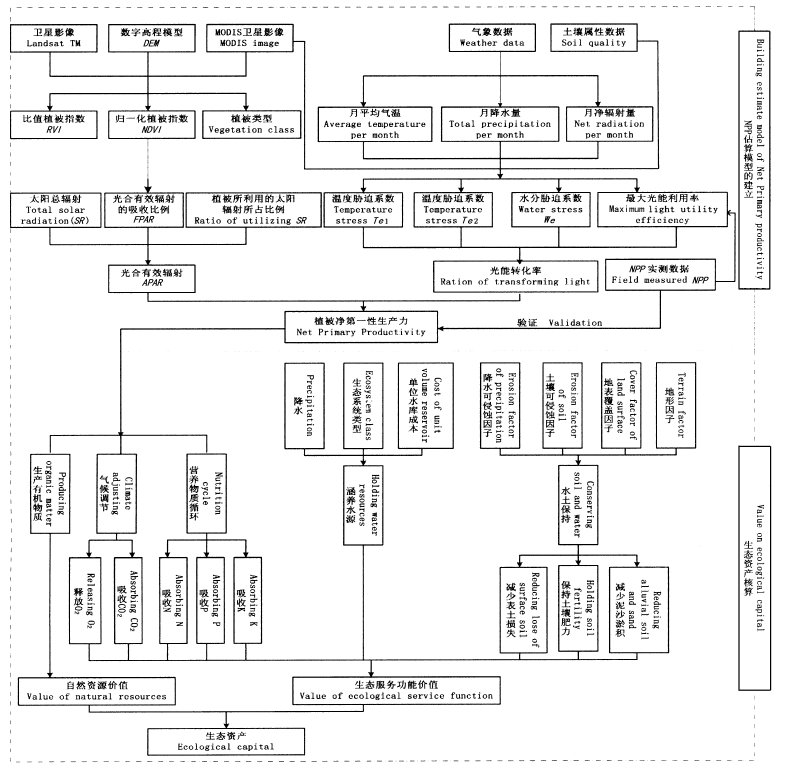
图1 基于遥感技术的生态资产核算体系
Fig.1 The calculating system of ecological capital based on remotely sensed data
| 项目 Item | 林地 Woodland | 灌丛 Shrub land | 草地 Grassland | 水田 Paddy field | 旱地 Dry land | 裸地 Bare land | 水域/湿地 Water/Wetland |
|---|---|---|---|---|---|---|---|
| 氮N | 0.004 180 | 0.013 294 | 0.013 289 | 0.013 288 | 0.013 203 | 0.013 273 | 0.004 204 |
| 磷P | 0.000 890 | 0.000 092 | 0.000 093 | 0.000 090 | 0.000 087 | 0.000 091 | 0.000 901 |
| 钾K | 0.001 810 | 0.008 904 | 0.008 908 | 0.008 915 | 0.008 874 | 0.008 909 | 0.001 802 |
表2 各生态系统营养物质分配率(g·g-1)
Table 2 Assigned rate of N、P、K of the ecosystems (g·g-1)
| 项目 Item | 林地 Woodland | 灌丛 Shrub land | 草地 Grassland | 水田 Paddy field | 旱地 Dry land | 裸地 Bare land | 水域/湿地 Water/Wetland |
|---|---|---|---|---|---|---|---|
| 氮N | 0.004 180 | 0.013 294 | 0.013 289 | 0.013 288 | 0.013 203 | 0.013 273 | 0.004 204 |
| 磷P | 0.000 890 | 0.000 092 | 0.000 093 | 0.000 090 | 0.000 087 | 0.000 091 | 0.000 901 |
| 钾K | 0.001 810 | 0.008 904 | 0.008 908 | 0.008 915 | 0.008 874 | 0.008 909 | 0.001 802 |
| 地区 Region | 年份 Year | 草地 Grassland | 灌丛 Shrub land | 裸地 Bare land | 旱地 Dry field | 水田 Paddy field | 水域/湿地 Water/Wetland | 林地 Woodland |
|---|---|---|---|---|---|---|---|---|
| 吴兴 Wuxing | 2001 | 4 952.79 | 17 565.42 | 22 269.38 | 990.80 | 20 335.34 | 6 237.54 | 13 648.74 |
| 2002 | 4 873.65 | 17 960.28 | 22 727.22 | 979.22 | 20 098.95 | 6 247.29 | 13 113.40 | |
| 2003 | 4 923.84 | 18 155.42 | 23 373.14 | 1 317.83 | 21 588.58 | 3 602.05 | 13 039.15 | |
| 2004 | 4 629.29 | 18 220.35 | 23 551.84 | 1 288.87 | 21 722.22 | 3 632.90 | 12 954.52 | |
| 南浔 Nanxun | 2001 | 12 716.42 | 32.56 | 14 749.10 | 1 224.23 | 34 795.04 | 6 300.88 | 781.78 |
| 2002 | 12 519.10 | 43.66 | 15 015.62 | 1 112.12 | 34 653.78 | 6 518.66 | 737.07 | |
| 2003 | 12 752.94 | 67.16 | 15 598.44 | 1 154.89 | 36 093.09 | 4 488.79 | 444.68 | |
| 2004 | 12 554.63 | 58.60 | 15 609.23 | 1 282.26 | 35 783.66 | 5 016.26 | 295.36 | |
| 安吉 Anji | 2001 | 6 394.90 | 43 284.16 | 11 820.60 | 2 629.89 | 18 981.35 | 3 216.26 | 102 272.84 |
| 2002 | 6 152.74 | 43 939.59 | 13 651.15 | 2 733.06 | 20 721.07 | 3 211.02 | 98 191.37 | |
| 2003 | 6 189.10 | 44 012.51 | 18 574.41 | 2 769.79 | 21 141.48 | 2 703.05 | 93 209.67 | |
| 2004 | 6 148.93 | 46 602.97 | 19 260.91 | 2 787.44 | 20 333.09 | 2 729.62 | 90 737.04 | |
| 德清 Deqing | 2001 | 1 364.79 | 12 997.16 | 17 388.21 | 2 126.63 | 19 365.75 | 10 686.36 | 29 671.10 |
| 2002 | 1 408.51 | 13 699.42 | 17 610.40 | 2 358.11 | 19 957.52 | 10 697.55 | 27 868.49 | |
| 2003 | 1 217.59 | 13 779.34 | 19 707.15 | 2 155.00 | 20 780.32 | 11 508.60 | 24 451.99 | |
| 2004 | 1 134.96 | 14 186.26 | 19 607.65 | 2 139.71 | 20 453.01 | 11 842.23 | 24 236.18 | |
| 长兴 Changxing | 2001 | 6 924.70 | 27 991.56 | 28 486.30 | 4 424.79 | 37 435.48 | 3 093.88 | 34 643.29 |
| 2002 | 6 753.45 | 28 892.15 | 29 994.50 | 4 491.07 | 38 100.22 | 3 128.95 | 31 639.67 | |
| 2003 | 6 413.92 | 30 226.34 | 30 117.03 | 4 659.87 | 38 633.37 | 1 983.02 | 30 966.46 | |
| 2004 | 6 798.74 | 30 361.07 | 30 466.65 | 4 740.41 | 39 052.20 | 1 909.71 | 29 671.23 | |
| 湖州 Huzhou | 2001 | 32 353.60 | 101 870.86 | 94 713.59 | 11 396.34 | 130 912.95 | 29 534.92 | 181 017.74 |
| 2002 | 31 707.45 | 104 535.09 | 98 998.89 | 11 673.57 | 133 531.53 | 29 803.47 | 171 550.00 | |
| 2003 | 314 97.39 | 106 240.76 | 107 370.16 | 12 057.38 | 138 236.84 | 24 285.51 | 162 111.95 | |
| 2004 | 31 266.54 | 109 429.25 | 108 496.29 | 12 238.70 | 137 344.17 | 25 130.72 | 157 894.33 |
表3 2001~2004年湖州市各县(级)土地利用/覆盖变化(公顷)
Table 3 Land use/land cover of the counties (or districts) in Houzhou from 2001 to 2004 (hm2)
| 地区 Region | 年份 Year | 草地 Grassland | 灌丛 Shrub land | 裸地 Bare land | 旱地 Dry field | 水田 Paddy field | 水域/湿地 Water/Wetland | 林地 Woodland |
|---|---|---|---|---|---|---|---|---|
| 吴兴 Wuxing | 2001 | 4 952.79 | 17 565.42 | 22 269.38 | 990.80 | 20 335.34 | 6 237.54 | 13 648.74 |
| 2002 | 4 873.65 | 17 960.28 | 22 727.22 | 979.22 | 20 098.95 | 6 247.29 | 13 113.40 | |
| 2003 | 4 923.84 | 18 155.42 | 23 373.14 | 1 317.83 | 21 588.58 | 3 602.05 | 13 039.15 | |
| 2004 | 4 629.29 | 18 220.35 | 23 551.84 | 1 288.87 | 21 722.22 | 3 632.90 | 12 954.52 | |
| 南浔 Nanxun | 2001 | 12 716.42 | 32.56 | 14 749.10 | 1 224.23 | 34 795.04 | 6 300.88 | 781.78 |
| 2002 | 12 519.10 | 43.66 | 15 015.62 | 1 112.12 | 34 653.78 | 6 518.66 | 737.07 | |
| 2003 | 12 752.94 | 67.16 | 15 598.44 | 1 154.89 | 36 093.09 | 4 488.79 | 444.68 | |
| 2004 | 12 554.63 | 58.60 | 15 609.23 | 1 282.26 | 35 783.66 | 5 016.26 | 295.36 | |
| 安吉 Anji | 2001 | 6 394.90 | 43 284.16 | 11 820.60 | 2 629.89 | 18 981.35 | 3 216.26 | 102 272.84 |
| 2002 | 6 152.74 | 43 939.59 | 13 651.15 | 2 733.06 | 20 721.07 | 3 211.02 | 98 191.37 | |
| 2003 | 6 189.10 | 44 012.51 | 18 574.41 | 2 769.79 | 21 141.48 | 2 703.05 | 93 209.67 | |
| 2004 | 6 148.93 | 46 602.97 | 19 260.91 | 2 787.44 | 20 333.09 | 2 729.62 | 90 737.04 | |
| 德清 Deqing | 2001 | 1 364.79 | 12 997.16 | 17 388.21 | 2 126.63 | 19 365.75 | 10 686.36 | 29 671.10 |
| 2002 | 1 408.51 | 13 699.42 | 17 610.40 | 2 358.11 | 19 957.52 | 10 697.55 | 27 868.49 | |
| 2003 | 1 217.59 | 13 779.34 | 19 707.15 | 2 155.00 | 20 780.32 | 11 508.60 | 24 451.99 | |
| 2004 | 1 134.96 | 14 186.26 | 19 607.65 | 2 139.71 | 20 453.01 | 11 842.23 | 24 236.18 | |
| 长兴 Changxing | 2001 | 6 924.70 | 27 991.56 | 28 486.30 | 4 424.79 | 37 435.48 | 3 093.88 | 34 643.29 |
| 2002 | 6 753.45 | 28 892.15 | 29 994.50 | 4 491.07 | 38 100.22 | 3 128.95 | 31 639.67 | |
| 2003 | 6 413.92 | 30 226.34 | 30 117.03 | 4 659.87 | 38 633.37 | 1 983.02 | 30 966.46 | |
| 2004 | 6 798.74 | 30 361.07 | 30 466.65 | 4 740.41 | 39 052.20 | 1 909.71 | 29 671.23 | |
| 湖州 Huzhou | 2001 | 32 353.60 | 101 870.86 | 94 713.59 | 11 396.34 | 130 912.95 | 29 534.92 | 181 017.74 |
| 2002 | 31 707.45 | 104 535.09 | 98 998.89 | 11 673.57 | 133 531.53 | 29 803.47 | 171 550.00 | |
| 2003 | 314 97.39 | 106 240.76 | 107 370.16 | 12 057.38 | 138 236.84 | 24 285.51 | 162 111.95 | |
| 2004 | 31 266.54 | 109 429.25 | 108 496.29 | 12 238.70 | 137 344.17 | 25 130.72 | 157 894.33 |
| 地区 Region | 年份 Year | 草地 Grassland | 灌丛 Shrub land | 裸地 Bare land | 旱地 Dry field | 水田 Paddy field | 林地 Woodland | 水域/湿地 Water/Wetland | 生态资产合计 Total |
|---|---|---|---|---|---|---|---|---|---|
| 吴兴 Wuxing | 2001 | 13 392.08 | 121 942.24 | 9 737.50 | 1 492.37 | 51 973.78 | 106 903.16 | 2 893.53 | 308 334.66 |
| 2002 | 13 801.49 | 136 974.12 | 11 333.70 | 1 755.59 | 62 699.09 | 118 931.82 | 3 264.88 | 348 760.69 | |
| 2003 | 8 490.24 | 92 785.83 | 8 723.36 | 2 280.74 | 53 204.97 | 83 310.13 | 1 823.51 | 250 618.78 | |
| 2004 | 8 968.55 | 96 928.87 | 9 905.51 | 2 407.48 | 57 638.57 | 86 863.11 | 2 014.44 | 264 726.53 | |
| 南浔 Nanxun | 2001 | 22 287.38 | 1 779.63 | 4 627.17 | 1 248.08 | 87 334.51 | 6 098.63 | 2 944.33 | 126 319.73 |
| 2002 | 24 086.29 | 1 891.77 | 5 695.31 | 1 098.67 | 104 820.06 | 6 436.39 | 3 430.72 | 147 459.21 | |
| 2003 | 18 221.01 | 1 829.80 | 3 962.98 | 1 006.61 | 79 864.74 | 5 960.67 | 2 104.74 | 112 950.55 | |
| 2004 | 19 073.51 | 1 727.60 | 4 765.74 | 1 173.93 | 85 313.80 | 5 229.36 | 2 504.19 | 119 788.13 | |
| 安吉 Anji | 2001 | 32 702.31 | 233 125.80 | 9 943.81 | 5 597.03 | 44 080.22 | 599 742.83 | 1 646.73 | 926 838.73 |
| 2002 | 34 587.26 | 265 964.67 | 11 038.69 | 6 295.09 | 54 445.27 | 605 889.66 | 1 673.23 | 979 893.87 | |
| 2003 | 36 746.3 | 225 176.95 | 12 685.57 | 5 118.47 | 59 284.66 | 514 036.74 | 1 297.60 | 854 346.29 | |
| 2004 | 35 903.78 | 284 679.55 | 13 283.01 | 5 605.98 | 83 222.31 | 485 148.88 | 1 487.49 | 909 331.00 | |
| 德清 Deqing | 2001 | 7 220.92 | 48 216.02 | 7 317.85 | 2 821.07 | 55 003.80 | 181 665.13 | 5 271.08 | 307 515.87 |
| 2002 | 7 795.51 | 55 423.45 | 8 271.69 | 3 245.15 | 68 402.07 | 166 162.41 | 5 737.31 | 315 037.59 | |
| 2003 | 7 585.52 | 40 396.60 | 6 765.36 | 2 349.53 | 48 820.47 | 132 703.02 | 4 795.12 | 243 415.62 | |
| 2004 | 7 379.04 | 56 271.08 | 7 679.69 | 2 704.76 | 51 004.28 | 134 524.29 | 5 396.35 | 264 959.49 | |
| 长兴 Changxing | 2001 | 22 765.85 | 93 765.46 | 14 204.54 | 6 762.81 | 107 638.63 | 201 338.65 | 1 540.26 | 448 016.20 |
| 2002 | 24 299.11 | 106 363.25 | 15 735.22 | 6 521.03 | 115 663.84 | 182 049.30 | 1 631.98 | 452 263.73 | |
| 2003 | 16 755.70 | 97 513.27 | 13 335.86 | 8 277.54 | 103 967.86 | 141 438.28 | 1 040.26 | 382 328.77 | |
| 2004 | 19 774.69 | 92 369.74 | 18 043.34 | 8 073.79 | 90 180.24 | 140 961.93 | 1 083.50 | 370 487.23 | |
| 湖州 Huzhou | 2001 | 98 368.55 | 498 829.15 | 45 830.86 | 17 921.37 | 346 030.94 | 1 095 748.40 | 14 295.93 | 2 117 025.20 |
| 2002 | 104 569.66 | 566 617.26 | 52 074.61 | 18 915.53 | 406 030.33 | 1 079 469.58 | 15 738.12 | 2 243 415.09 | |
| 2003 | 87 798.77 | 457 702.45 | 45 473.13 | 19 032.88 | 345 142.69 | 877 448.82 | 11 061.23 | 1 843 659.97 | |
| 2004 | 91 099.57 | 531 976.84 | 53 677.30 | 19 965.95 | 367 359.20 | 852 727.58 | 12 485.97 | 1 929 292.41 |
表4 2001~2004年湖州市各县(区)生态资产(万元)
Table 4 Ecological capital (104 RMB) of countries (or districts) in Huzhou from 2001 to 2004
| 地区 Region | 年份 Year | 草地 Grassland | 灌丛 Shrub land | 裸地 Bare land | 旱地 Dry field | 水田 Paddy field | 林地 Woodland | 水域/湿地 Water/Wetland | 生态资产合计 Total |
|---|---|---|---|---|---|---|---|---|---|
| 吴兴 Wuxing | 2001 | 13 392.08 | 121 942.24 | 9 737.50 | 1 492.37 | 51 973.78 | 106 903.16 | 2 893.53 | 308 334.66 |
| 2002 | 13 801.49 | 136 974.12 | 11 333.70 | 1 755.59 | 62 699.09 | 118 931.82 | 3 264.88 | 348 760.69 | |
| 2003 | 8 490.24 | 92 785.83 | 8 723.36 | 2 280.74 | 53 204.97 | 83 310.13 | 1 823.51 | 250 618.78 | |
| 2004 | 8 968.55 | 96 928.87 | 9 905.51 | 2 407.48 | 57 638.57 | 86 863.11 | 2 014.44 | 264 726.53 | |
| 南浔 Nanxun | 2001 | 22 287.38 | 1 779.63 | 4 627.17 | 1 248.08 | 87 334.51 | 6 098.63 | 2 944.33 | 126 319.73 |
| 2002 | 24 086.29 | 1 891.77 | 5 695.31 | 1 098.67 | 104 820.06 | 6 436.39 | 3 430.72 | 147 459.21 | |
| 2003 | 18 221.01 | 1 829.80 | 3 962.98 | 1 006.61 | 79 864.74 | 5 960.67 | 2 104.74 | 112 950.55 | |
| 2004 | 19 073.51 | 1 727.60 | 4 765.74 | 1 173.93 | 85 313.80 | 5 229.36 | 2 504.19 | 119 788.13 | |
| 安吉 Anji | 2001 | 32 702.31 | 233 125.80 | 9 943.81 | 5 597.03 | 44 080.22 | 599 742.83 | 1 646.73 | 926 838.73 |
| 2002 | 34 587.26 | 265 964.67 | 11 038.69 | 6 295.09 | 54 445.27 | 605 889.66 | 1 673.23 | 979 893.87 | |
| 2003 | 36 746.3 | 225 176.95 | 12 685.57 | 5 118.47 | 59 284.66 | 514 036.74 | 1 297.60 | 854 346.29 | |
| 2004 | 35 903.78 | 284 679.55 | 13 283.01 | 5 605.98 | 83 222.31 | 485 148.88 | 1 487.49 | 909 331.00 | |
| 德清 Deqing | 2001 | 7 220.92 | 48 216.02 | 7 317.85 | 2 821.07 | 55 003.80 | 181 665.13 | 5 271.08 | 307 515.87 |
| 2002 | 7 795.51 | 55 423.45 | 8 271.69 | 3 245.15 | 68 402.07 | 166 162.41 | 5 737.31 | 315 037.59 | |
| 2003 | 7 585.52 | 40 396.60 | 6 765.36 | 2 349.53 | 48 820.47 | 132 703.02 | 4 795.12 | 243 415.62 | |
| 2004 | 7 379.04 | 56 271.08 | 7 679.69 | 2 704.76 | 51 004.28 | 134 524.29 | 5 396.35 | 264 959.49 | |
| 长兴 Changxing | 2001 | 22 765.85 | 93 765.46 | 14 204.54 | 6 762.81 | 107 638.63 | 201 338.65 | 1 540.26 | 448 016.20 |
| 2002 | 24 299.11 | 106 363.25 | 15 735.22 | 6 521.03 | 115 663.84 | 182 049.30 | 1 631.98 | 452 263.73 | |
| 2003 | 16 755.70 | 97 513.27 | 13 335.86 | 8 277.54 | 103 967.86 | 141 438.28 | 1 040.26 | 382 328.77 | |
| 2004 | 19 774.69 | 92 369.74 | 18 043.34 | 8 073.79 | 90 180.24 | 140 961.93 | 1 083.50 | 370 487.23 | |
| 湖州 Huzhou | 2001 | 98 368.55 | 498 829.15 | 45 830.86 | 17 921.37 | 346 030.94 | 1 095 748.40 | 14 295.93 | 2 117 025.20 |
| 2002 | 104 569.66 | 566 617.26 | 52 074.61 | 18 915.53 | 406 030.33 | 1 079 469.58 | 15 738.12 | 2 243 415.09 | |
| 2003 | 87 798.77 | 457 702.45 | 45 473.13 | 19 032.88 | 345 142.69 | 877 448.82 | 11 061.23 | 1 843 659.97 | |
| 2004 | 91 099.57 | 531 976.84 | 53 677.30 | 19 965.95 | 367 359.20 | 852 727.58 | 12 485.97 | 1 929 292.41 |
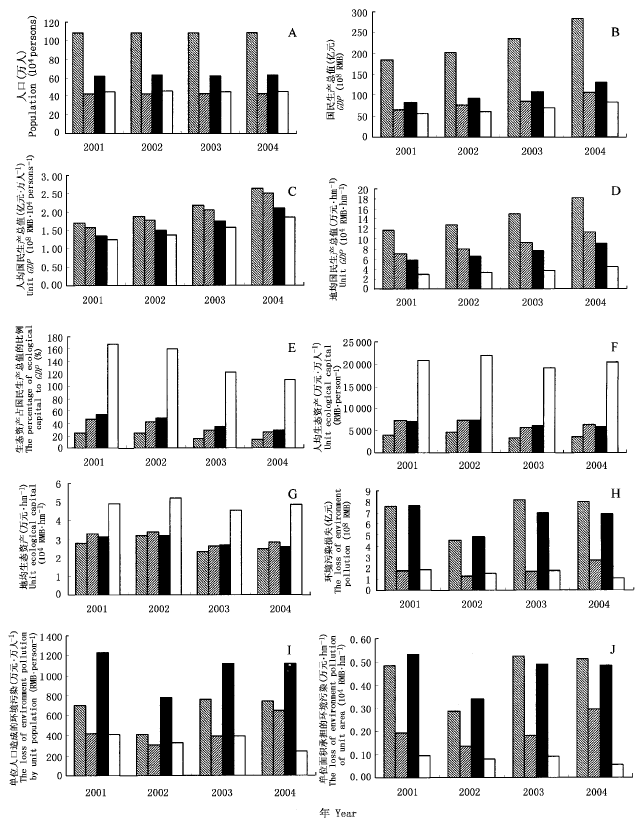
图2 湖州市各县(区)自然、社会经济指标分析
Fig.2 Natural, social and economical indexes analysis of counties and districts in Huzhou
| [1] | Bjorklund J, Limburg K, Rydberg T (1999). Impact of production intensity on the ability of the agricultural landscape to generate ecosystem services: an example from Sweden. Ecological Economics, 29,269-291. |
| [2] | Bolund P, Hunhammar S (1999). Ecosystem services in urban areas. Ecological Economics, 29,293-301. |
| [3] | Chen ZX (陈仲新), Zhang XS (张新时) (2000). The benefit value of Chinese ecosystem. Chinese Science Bulletin (科学通报), 45,17-22. (in Chinese with English abstract) |
| [4] | Costanza R, d'Arge R, de Groot R, Farber S, Grasso M, Hannon B, Limburg K, Naeem S, O'Neill RV, Paruelo J, Raskin RG, Sutton P, van den Belt M (1997). The value of the world's ecosystem services and natural capital. Nature, 387,253-260. |
| [5] |
Daily GC, Søderqvist T, Aniyar S, Arrow K, Dasgupta P, Ehrlich PR, Folke C, Jansson AM, Jansson BO, Kautsky N, Levin S, Lubchenco J, M⁉ler KG, Simpson P, Starrett D, Tilman D, Walker B (2000). The value of nature and nature of value. Science, 289,395-396.
DOI URL PMID |
| [6] | David P (1997). Ecological accountancy. Science, 387,253-260. |
| [7] | Dixon J, Bakkes J, Hanilton K translated by Zhang KM (张坤民)) (1998). Expanding the Measure of Wealth: Indicators of Environmental Sustainable Development, (扩展衡量财富的手段——环境可持续发展指标). China Environmental Science Press, Beijing. (in Chinese) |
| [8] |
Field CB, Behrenfeld MJ, Randerson JT, Falkowski P (1998). Primary production of the biosphere: integrating terrestrial and oceanic components. Science, 281,237-240.
URL PMID |
| [9] | Holmund CM, Hammer M (1999). Ecosystem services generated by fish population. Ecological Economics, 29,253-268. |
| [10] | Huang XW (黄兴文), Chen BM (陈百明) (1999). The theory and application about the regionalization of Chinese ecological assets. Acta Ecologica Sinica (生态学报), 19,602-606. (in Chinese with English abstract) |
| [11] | Ouyang ZY (欧阳志云), Wang XK (王效科), Miao H (苗鸿) (1999). A primary study on Chinese terrestrial ecosystem services and their ecological-economic values. Acta Ecologica Sinica (生态学报), 19,607-612. (in Chinese with English abstract) |
| [12] | Pan YZ (潘耀忠), Shi PJ (史培军), Zhu WQ (朱文泉), Gu XH (顾晓鹤), Fan YD (范一大), Li J (李京) (2004). Quantitative measured ecological capital on Chinese terrestrial ecosystem based on remote sensed data. Science in China Ser. D (中国科学D辑), 34,375-384. (in Chinese with English abstract) |
| [13] | Pearce D, Atkinson G (1993). Capital theory and the measure of sustainable development: an indicator of weak sustainability. Ecological Economics, 8,103-108. |
| [14] | Potschin MB, Haines-Young RH (2003). Improving the quality of environmental assessments using the concept of natural capital: a case study from southern Germany. Landscape and Urban Planning, 63,93-108. |
| [15] | Potter CS, Randerson JT, Field CB, Matson PA, Vitousek PM, Mooney HA, Klooster SA (1993). Terrestrial ecosystem production: a process model based on global on global satellite and surface data. Global Biochemical Cycles, 7,811-841. |
| [16] | Shi PJ (史培军), Pan YZ (潘耀忠), Chen YH (陈云浩), Li XB (李晓兵), Li J (李京), Jing GF (景贵飞), Xian ZK (鲜祖康), Zhang SY (张淑英) (2002). Technical system of ecological capital integrated measurement using multi-scale remotely sensed data. Advance in Earth Sciences (地球科学进展), 17,169-173. (in Chinese with English abstract) |
| [17] | Vitousek P, Ehrlich PR, Ehrlich AH, Matson P (1986). Human appropriation of the products of photosynthesis. BioScience, 36,368-373. |
| [18] | Wackernagel M, Lewan L, Hansson CB (1999). Evaluating the use of natural capital with the ecological footprint: application in Sweden and subregions. AMBIO, 28,604-612. |
| [1] | 郝晴, 黄昌. 森林地上生物量遥感估算研究综述[J]. 植物生态学报, 2023, 47(10): 1356-1374. |
| [2] | 丛楠, 张扬建, 朱军涛. 北半球中高纬度地区近30年植被春季物候温度敏感性[J]. 植物生态学报, 2022, 46(2): 125-135. |
| [3] | 姜艳, 陈兴芳, 杨旭杰. 基于Landsat影像的武汉东湖30年来水生植物动态变化[J]. 植物生态学报, 2022, 46(12): 1551-1561. |
| [4] | 田佳玉, 王彬, 张志明, 林露湘. 光谱多样性在植物多样性监测与评估中的应用[J]. 植物生态学报, 2022, 46(10): 1129-1150. |
| [5] | 严正兵, 刘树文, 吴锦. 高光谱遥感技术在植物功能性状监测中的应用与展望[J]. 植物生态学报, 2022, 46(10): 1151-1166. |
| [6] | 陈哲, 汪浩, 王金洲, 石慧瑾, 刘慧颖, 贺金生. 基于物候相机归一化植被指数估算高寒草地植物地上生物量的季节动态[J]. 植物生态学报, 2021, 45(5): 487-495. |
| [7] | 郭庆华, 胡天宇, 马勤, 徐可心, 杨秋丽, 孙千惠, 李玉美, 苏艳军. 新一代遥感技术助力生态系统生态学研究[J]. 植物生态学报, 2020, 44(4): 418-435. |
| [8] | 张富广, 曾彪, 杨太保. 气候变化背景下近30年祁连山高寒荒漠分布时空变化[J]. 植物生态学报, 2019, 43(4): 305-319. |
| [9] | 张峰,周广胜. 植被含水量高光谱遥感监测研究进展[J]. 植物生态学报, 2018, 42(5): 517-525. |
| [10] | 王克清, 王鹤松, 孙建新. 遥感GPP模型在中国地区多站点的应用与比较[J]. 植物生态学报, 2017, 41(3): 337-347. |
| [11] | 高林, 王晓菲, 顾行发, 田庆久, 焦俊男, 王培燕, 李丹. 植冠下土壤类型差异对遥感估算冬小麦叶面积指数的影响[J]. 植物生态学报, 2017, 41(12): 1273-1288. |
| [12] | 刘涛宇, 赵霞, 沈海花, 胡会峰, 黄文江, 方精云. 灌丛化草原灌木和草本植物光谱特征差异及灌木盖度反演——以内蒙古镶黄旗为例[J]. 植物生态学报, 2016, 40(10): 969-979. |
| [13] | 马勇刚, 张弛, 陈曦. 利用遥感数据优化物候模型时样本选择的新方法[J]. 植物生态学报, 2015, 39(3): 264-274. |
| [14] | 彭资, 谷成燕, 刘智勇, 林雯, 周平. 东江流域1989-2009年土地利用变化对生态承载力的影响[J]. 植物生态学报, 2014, 38(7): 675-686. |
| [15] | 张峰, 周广胜. 玉米农田冠层光合参数的多光谱遥感反演[J]. 植物生态学报, 2014, 38(7): 710-719. |
| 阅读次数 | ||||||
|
全文 |
|
|||||
|
摘要 |
|
|||||
Copyright © 2022 版权所有 《植物生态学报》编辑部
地址: 北京香山南辛村20号, 邮编: 100093
Tel.: 010-62836134, 62836138; Fax: 010-82599431; E-mail: apes@ibcas.ac.cn, cjpe@ibcas.ac.cn
备案号: 京ICP备16067583号-19